Shirin's playgRound exploring and playing with data in R

-
02 Nov 2017 » Explore Predictive Maintenance with flexdashboard
-
28 Sep 2017 » Blockchain & distributed ML - my report from the data2day conference
-
20 Sep 2017 » From Biology to Industry. A Blogger’s Journey to Data Science.
-
19 Sep 2017 » Why I use R for Data Science - An Ode to R
-
14 Sep 2017 » Moving my blog to blogdown
-
06 Sep 2017 » Data Science for Fraud Detection
-
04 Sep 2017 » Migrating from GitHub to GitLab with RStudio (Tutorial)
-
28 Jul 2017 » Social Network Analysis and Topic Modeling of codecentric’s Twitter friends and followers
-
17 Jul 2017 » How to do Optical Character Recognition (OCR) of non-English documents in R using Tesseract?
-
28 Jun 2017 » Characterizing Twitter followers with tidytext
-
13 Jun 2017 » Data Science for Business - Time Series Forecasting Part 3: Forecasting with Facebook's Prophet
-
09 Jun 2017 » Data Science for Business - Time Series Forecasting Part 2: Forecasting with timekit
-
28 May 2017 » Data Science for Business - Time Series Forecasting Part 1: EDA & Data Preparation
-
20 May 2017 » New R Users group in Münster!
-
15 May 2017 » Network analysis of Game of Thrones family ties
-
02 May 2017 » Update to autoencoders and anomaly detection with machine learning in fraud analytics
-
01 May 2017 » Autoencoders and anomaly detection with machine learning in fraud analytics
-
23 Apr 2017 » Does money buy happiness after all? Machine Learning with One Rule
-
23 Apr 2017 » Explaining complex machine learning models with LIME
-
16 Apr 2017 » Happy EasteR: Plotting hare populations in Germany
-
09 Apr 2017 » Data on tour: Plotting 3D maps and location tracks
-
02 Apr 2017 » Dealing with unbalanced data in machine learning
-
31 Mar 2017 » Building meaningful machine learning models for disease prediction
-
16 Mar 2017 » Plotting trees from Random Forest models with ggraph
-
07 Mar 2017 » Hyper-parameter Tuning with Grid Search for Deep Learning
-
27 Feb 2017 » Building deep neural nets with h2o and rsparkling that predict arrhythmia of the heart
-
19 Feb 2017 » Predicting food preferences with sparklyr (machine learning)
-
12 Feb 2017 » Conditional ggplot2 geoms in functions (QTL plots)
-
06 Feb 2017 » Scratching the Surface of Gender Biases
-
30 Jan 2017 » New features in World Gender Statistics app
-
29 Jan 2017 » Exploring World Gender Statistics with Shiny
-
22 Jan 2017 » R vs Python - a One-on-One Comparison
-
15 Jan 2017 » Feature Selection in Machine Learning (Breast Cancer Datasets)
-
05 Jan 2017 » Gene homology Part 3 - Visualizing Gene Ontology of Conserved Genes
-
30 Dec 2016 » How to map your Google location history with R
-
22 Dec 2016 » Animating Plots of Beer Ingredients and Sin Taxes over Time
-
18 Dec 2016 » How to build a Shiny app for disease- & trait-associated locations of the human genome
-
14 Dec 2016 » Gene homology Part 2 - creating directed networks with igraph
-
11 Dec 2016 » Creating a network of human gene homology with R and D3
-
04 Dec 2016 » How to set up your own R blog with Github pages and Jekyll Bootstrap
-
02 Dec 2016 » Extreme Gradient Boosting and Preprocessing in Machine Learning - Addendum to predicting flu outcome with R
-
27 Nov 2016 » Can we predict flu deaths with Machine Learning and R?
-
20 Nov 2016 » Analysing the Gilmore Girls' coffee addiction with R
-
13 Nov 2016 » Creating a Gilmore Girls character network with R
-
06 Nov 2016 » Is 'Yeah' Josh and Chuck's favorite word?
-
01 Nov 2016 » Exploring the human genome (Part 2) - Transcripts
-
23 Oct 2016 » Exploring the human genome (Part 1) - Gene Annotations
-
16 Oct 2016 » USA/ Canada Roadtrip 2016
-
29 Sep 2016 » DESeq2 Course Work
-
28 Sep 2016 » exprAnalysis package
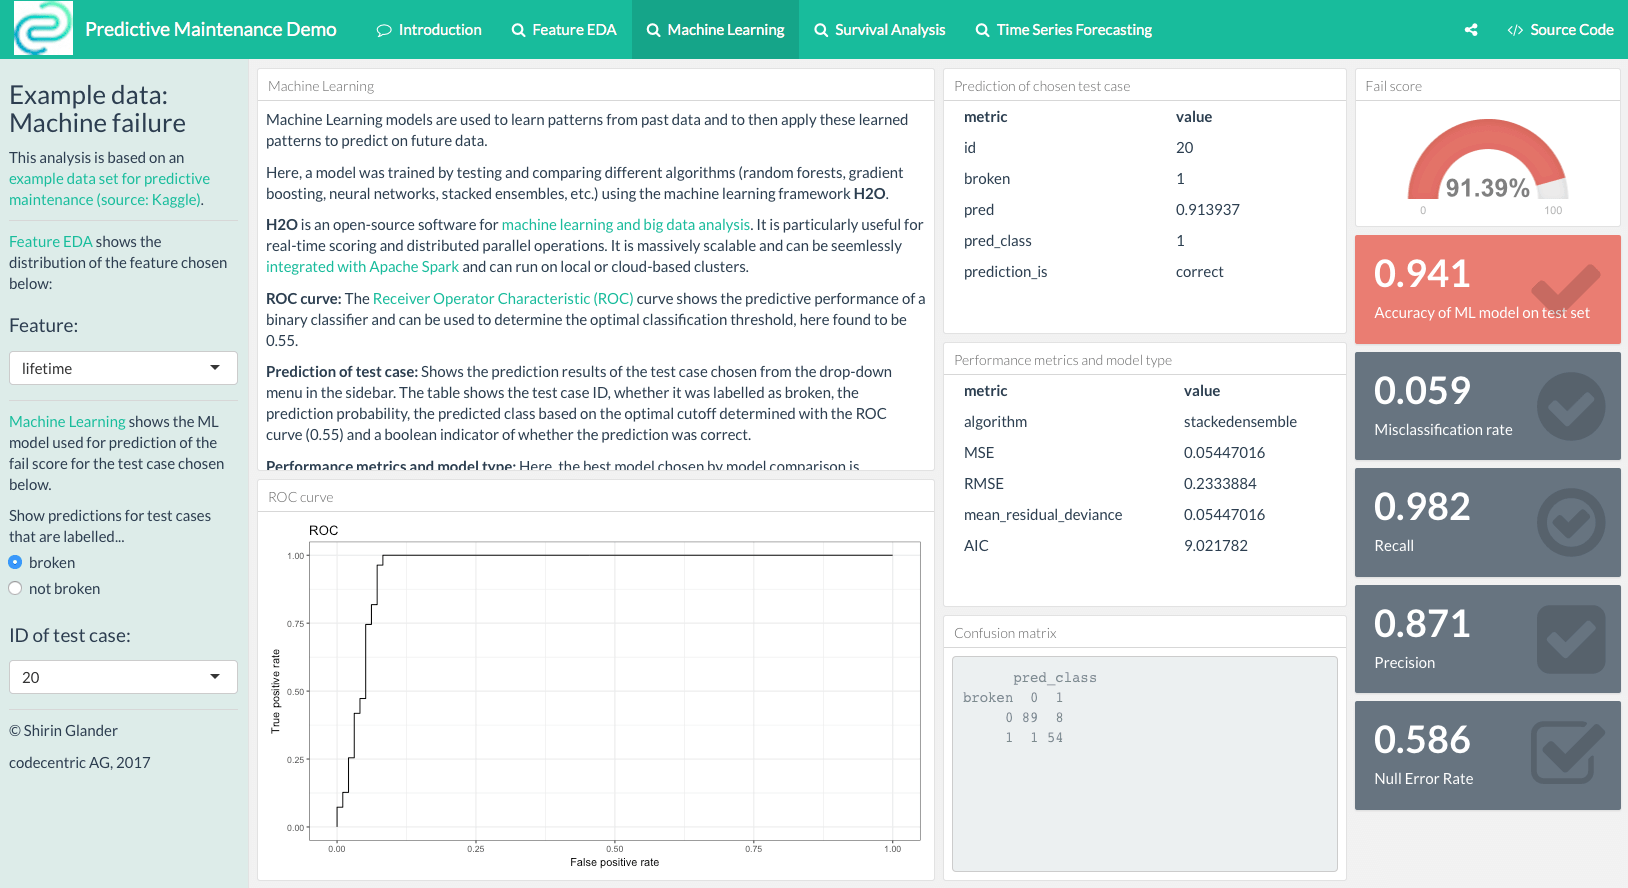
I have written the following post about Predictive Maintenance and flexdashboard at my company codecentric’s blog:
Continue reading...

Today, I have given a webinar for the Applied Epidemiology Didactic of the University of Wisconsin - Madison titled “From Biology to Industry. A Blogger’s Journey to Data Science.”
Continue reading...
I have written a blog post about why I love R and prefer it to other languages. The post is on my new site, but since it isn’t on R-bloggers yet I am also posting the link here:
Continue reading...
It’s been a long time coming but I finally moved my blog from Jekyll/Bootstrap on Github pages to blogdown, Hugo and Netlify! Moreover, I also now have my own domain name www.shirin-glander.de. :-)
Continue reading...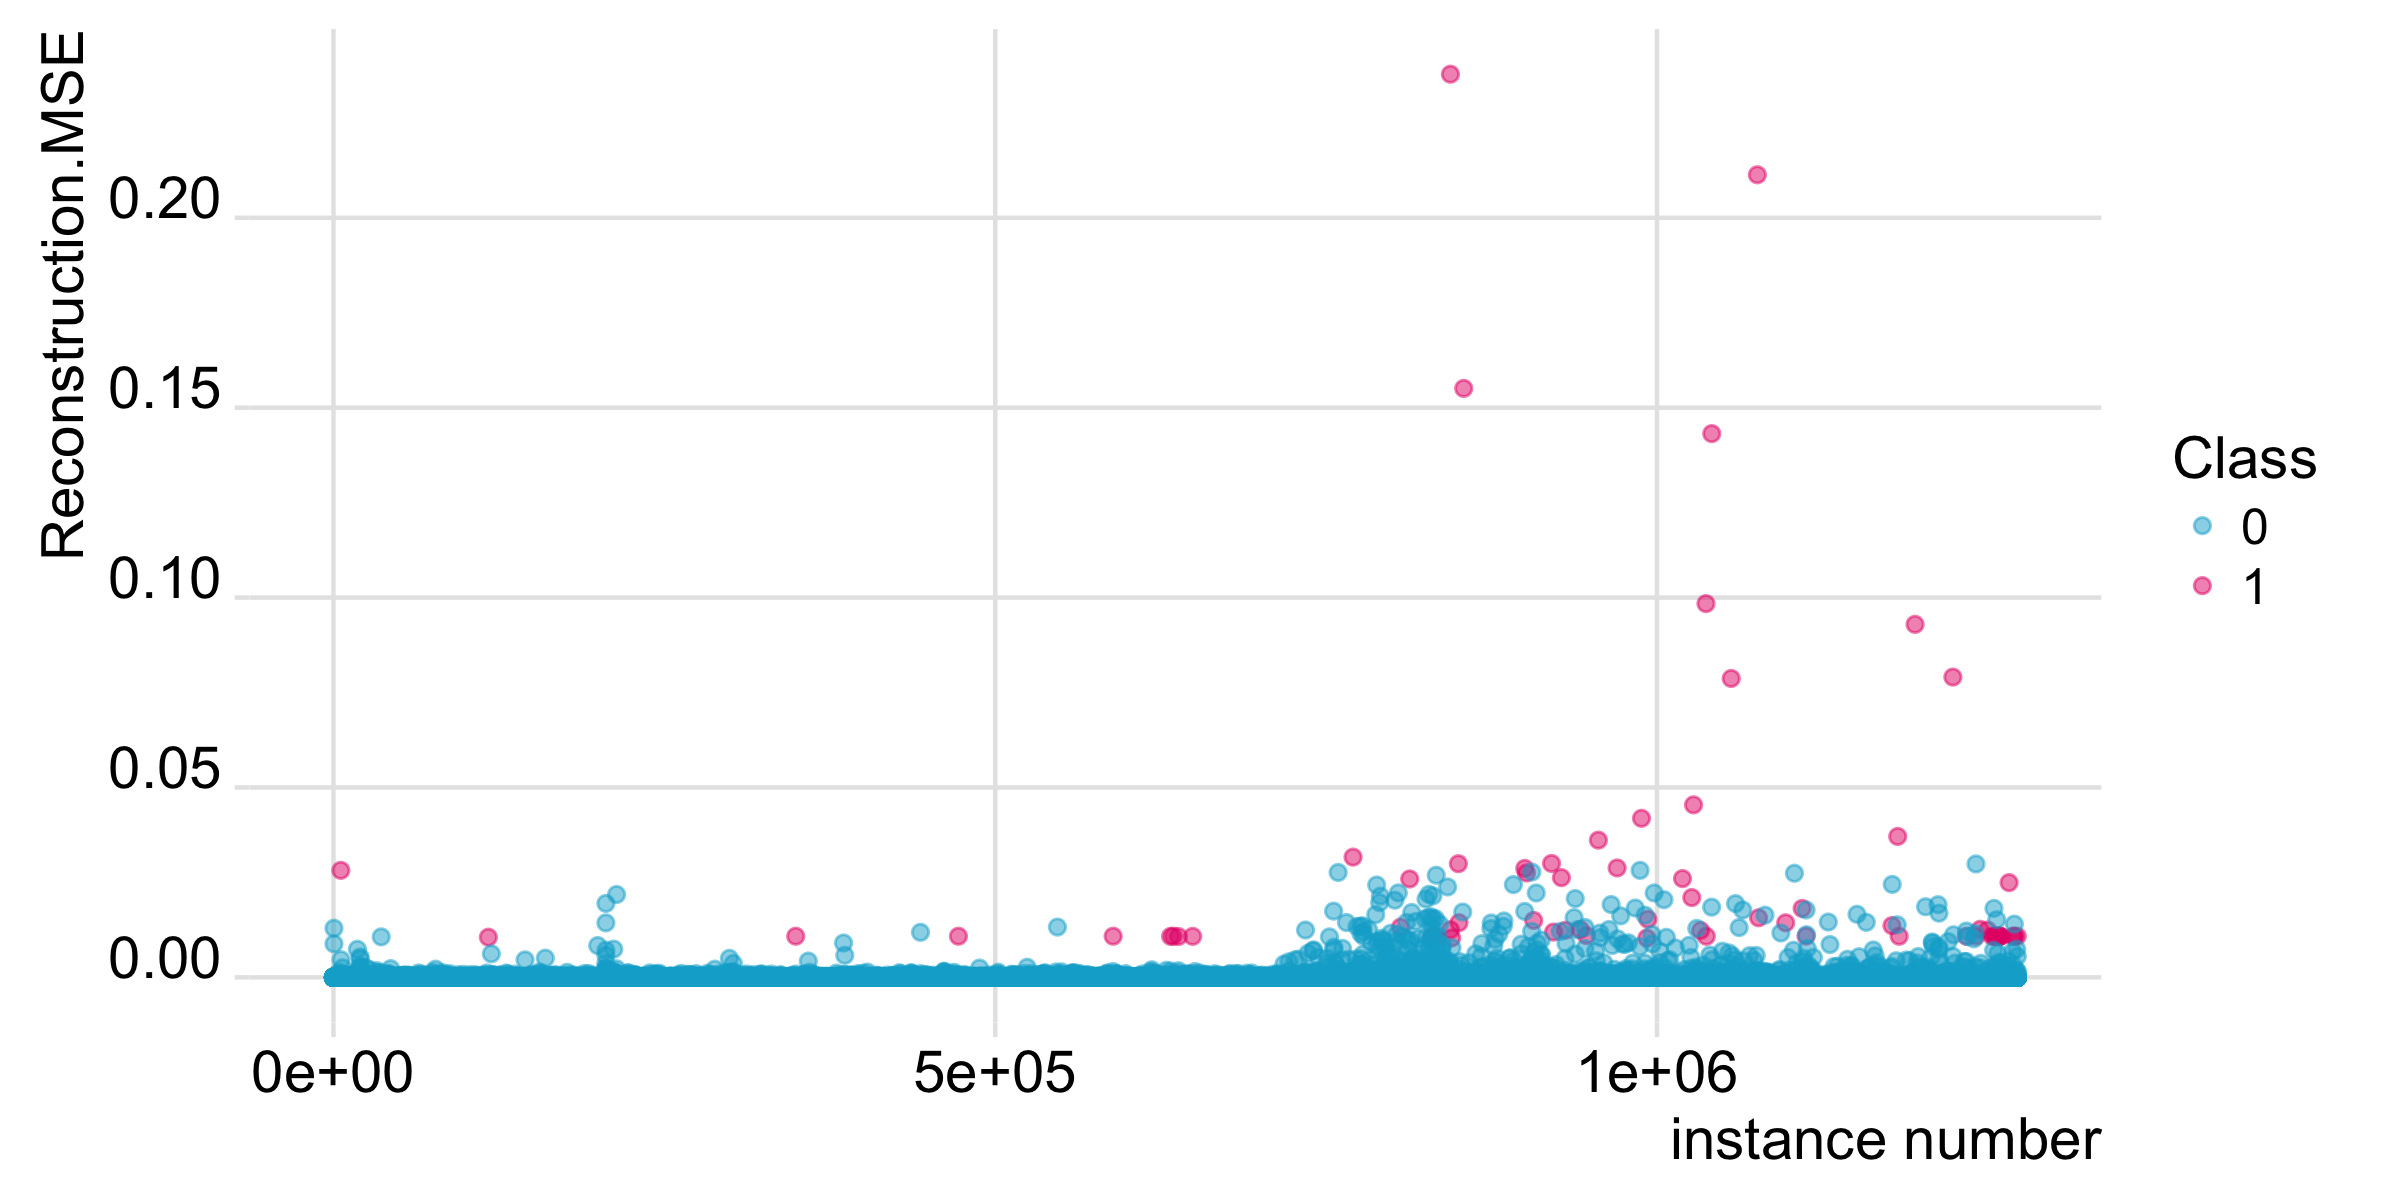
I have written the following post about Data Science for Fraud Detection at my company codecentric’s blog:
Continue reading...
GitHub vs. GitLab
Continue reading...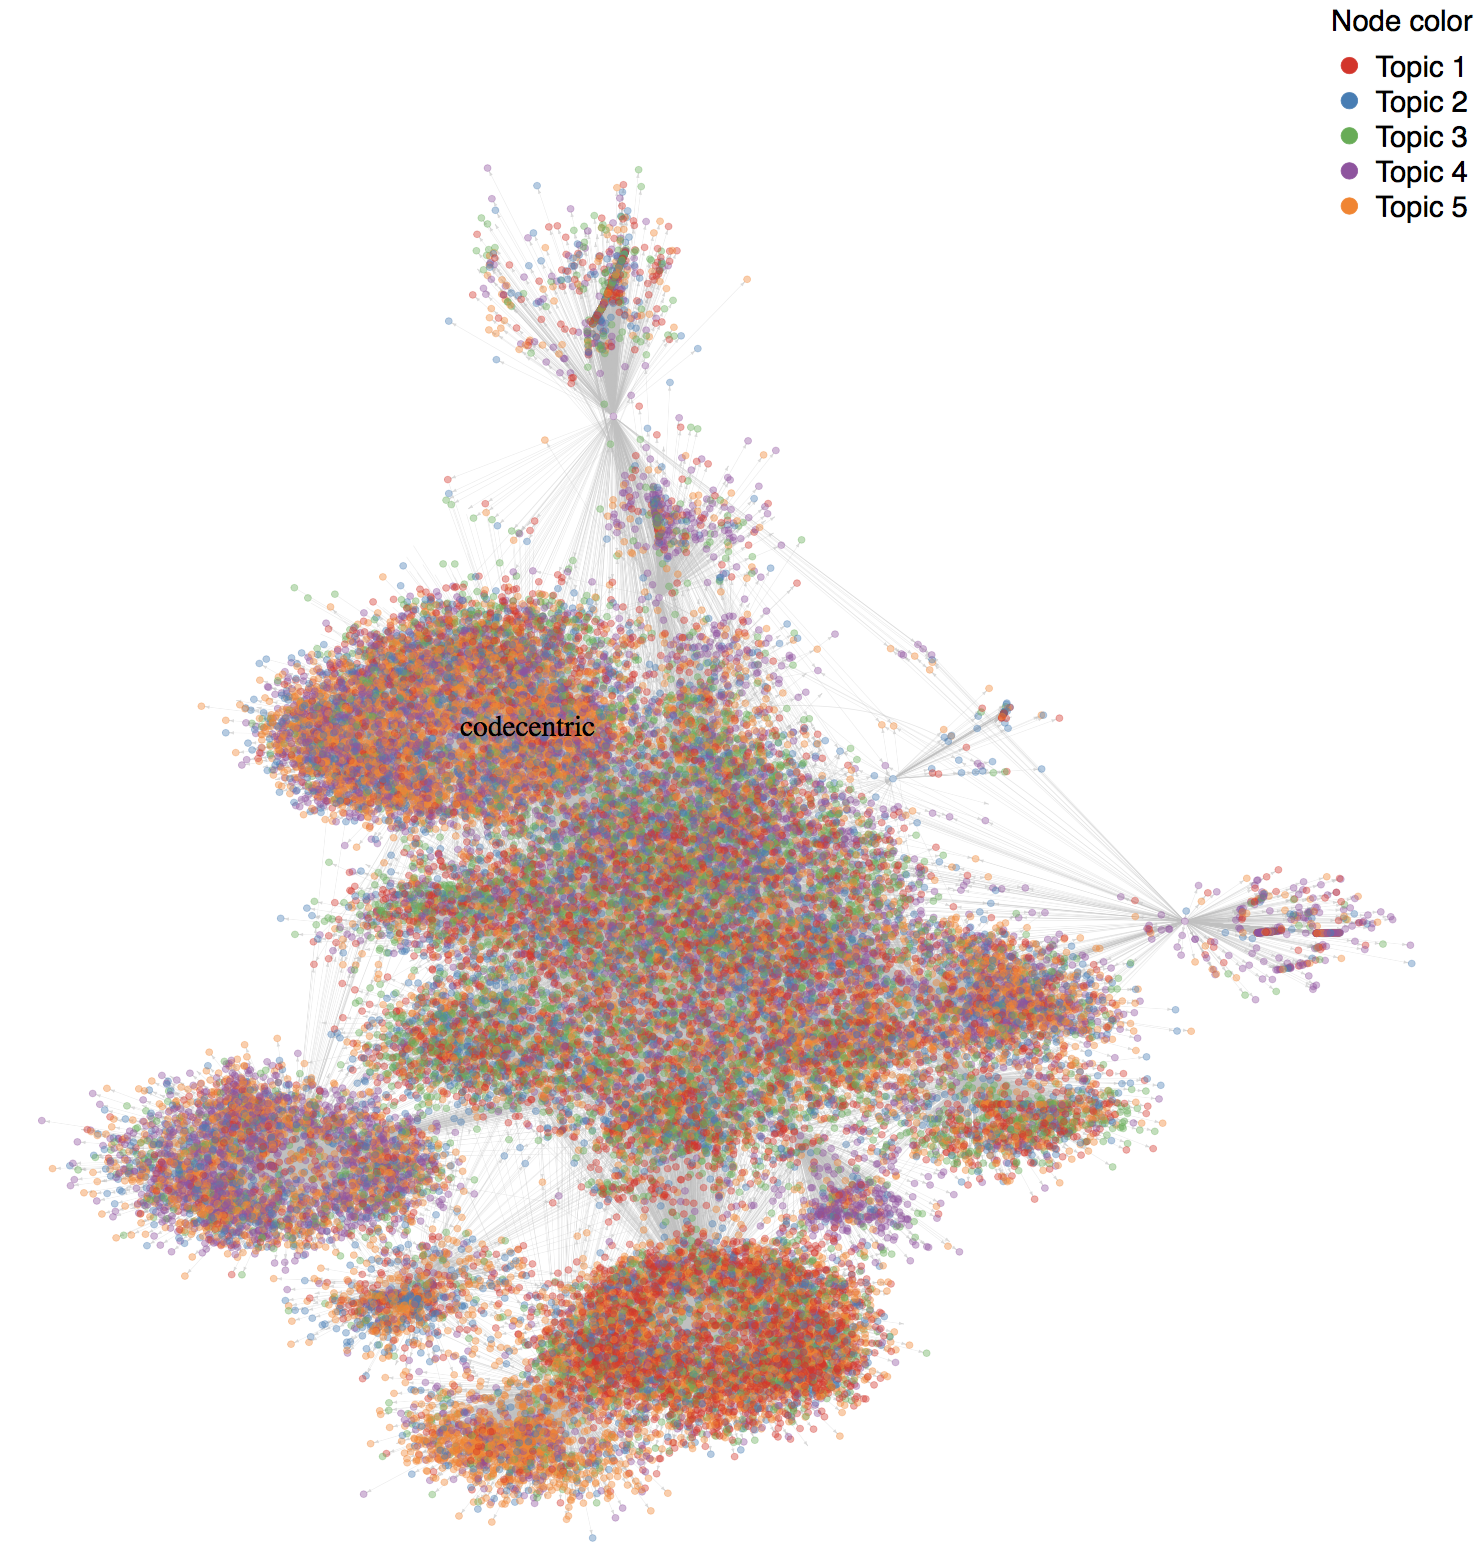
I have written the following post about Social Network Analysis and Topic Modeling of codecentric’s Twitter friends and followers for codecentric’s blog:
Continue reading...
One of the many great packages of rOpenSci has implemented the open source engine Tesseract.
Continue reading...
Lately, I have been more and more taken with tidy principles of data analysis. They are elegant and make analyses clearer and easier to comprehend. Following the tidyverse and ggraph, I have been quite intrigued by applying tidy principles to text analysis with Julia Silge and David Robinson’s tidytext.
Continue reading...
In my last two posts (Part 1 and Part 2), I explored time series forecasting with the timekit package.
Continue reading...
In my last post, I prepared and visually explored time series data.
Continue reading...
Data Science is a fairly broad term and encompasses a wide range of techniques from data visualization to statistics and machine learning models. But the techniques are only tools in a - sometimes very messy - toolbox. And while it is important to know and understand these tools, here, I want to go at it from a different angle: What is the task at hand that data science tools can help tackle, and what question do we want to have answered?
Continue reading...
This is to announce that Münster now has its very own R users group!
Continue reading...
In this post, I am exploring network analysis techniques in a family network of major characters from Game of Thrones.
Continue reading...
This is a reply to Wojciech Indyk’s comment on yesterday’s post on autoencoders and anomaly detection with machine learning in fraud analytics:
Continue reading...
All my previous posts on machine learning have dealt with supervised learning. But we can also use machine learning for unsupervised learning. The latter are e.g. used for clustering and (non-linear) dimensionality reduction.
Continue reading...
This week, I am exploring Holger K. von Jouanne-Diedrich’s OneR package for machine learning. I am running an example analysis on world happiness data and compare the results with other machine learning models (decision trees, random forest, gradient boosting trees and neural nets).
Continue reading...
The classification decisions made by machine learning models are usually difficult - if not impossible - to understand by our human brains. The complexity of some of the most accurate classifiers, like neural networks, is what makes them perform so well - often with better results than achieved by humans. But it also makes them inherently hard to explain, especially to non-data scientists.
Continue reading...
For Easter, I wanted to have a look at the number of hares in Germany. Wild hare populations have been rapidly declining over the last 10 years but during the last three years they have at least been stable.
Continue reading...
Recently, I was on Gran Canaria for a vacation. So, what better way to keep up the holiday spirit a while longer than to visualize all the places we went in R!?
Continue reading...
In my last post, where I shared the code that I used to produce an example analysis to go along with my webinar on building meaningful models for disease prediction, I mentioned that it is advised to consider over- or under-sampling when you have unbalanced data sets. Because my focus in this webinar was on evaluating model performance, I did not want to add an additional layer of complexity and therefore did not further discuss how to specifically deal with unbalanced data.
Continue reading...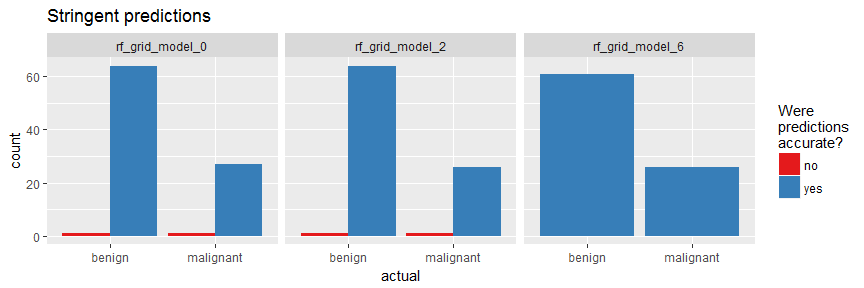
Webinar for the ISDS R Group
Continue reading...
Today, I want to show how I use Thomas Lin Pedersen’s awesome ggraph package to plot decision trees from Random Forest models.
Continue reading...
Last week I showed how to build a deep neural network with h2o and rsparkling. As we could see there, it is not trivial to optimize the hyper-parameters for modeling. Hyper-parameter tuning with grid search allows us to test different combinations of hyper-parameters and find one with improved accuracy.
Continue reading...
Last week, I introduced how to run machine learning applications on Spark from within R, using the sparklyr package. This week, I am showing how to build feed-forward deep neural networks or multilayer perceptrons. The models in this example are built to classify ECG data into being either from healthy hearts or from someone suffering from arrhythmia. I will show how to prepare a dataset for modeling, setting weights and other modeling parameters and finally, how to evaluate model performance with the h2o package via rsparkling.
Continue reading...
This week I want to show how to run machine learning applications on a Spark cluster. I am using the sparklyr package, which provides a handy interface to access Apache Spark functionalities via R.
Continue reading...
When running an analysis, I am usually combining functions from multiple packages. Most of these packages come with their own plotting functions. And while they are certainly convenient in that they allow me to get a quick glance at the data or the output, they all have their own style. If I want to prepare a report, proposal or a paper though, I want all my plots to come from a single cast so that they give a consistent feel to the story I want to tell with my data.
Continue reading...
Today, I want to share my analysis of the World Gender Statistics dataset.
Continue reading...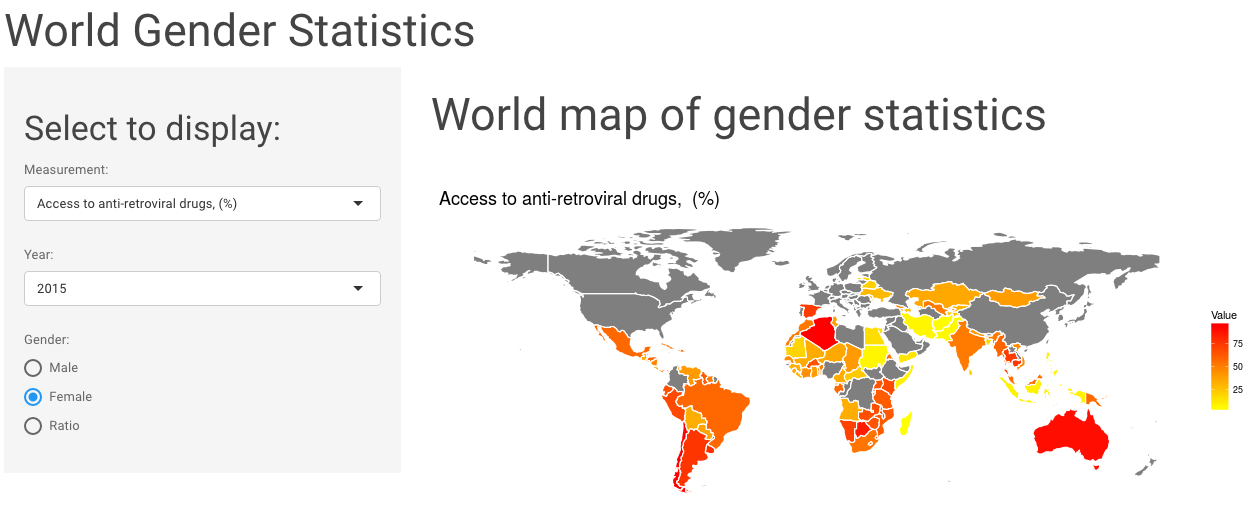
In my last post, I built a shiny app to explore World Gender Statistics.
Continue reading...
This week I explored the World Gender Statistics dataset. You can look at 160 measurements over 56 years with my Shiny app here.
Continue reading...
I’m an avid R user and rarely use anything else for data analysis and visualisations. But while R is my go-to, in some cases, Python might actually be a better alternative.
Continue reading...
Machine learning uses so called features (i.e. variables or attributes) to generate predictive models. Using a suitable combination of features is essential for obtaining high precision and accuracy. Because too many (unspecific) features pose the problem of overfitting the model, we generally want to restrict the features in our models to those, that are most relevant for the response variable we want to predict. Using as few features as possible will also reduce the complexity of our models, which means it needs less time and computer power to run and is easier to understand.
Continue reading...
Which genes have homologs in many species?
Continue reading...
It’s no secret that Google Big Brothers most of us. But at least they allow us to access quite a lot of the data they have collected on us. Among this is the Google location history.
Continue reading...
With the upcoming holidays, I thought it fitting to finally explore the ttbbeer package. It contains data on beer ingredients used in US breweries from 2006 to 2015 and on the (sin) tax rates for beer, champagne, distilled spirits, wine and various tobacco items since 1862.
Continue reading...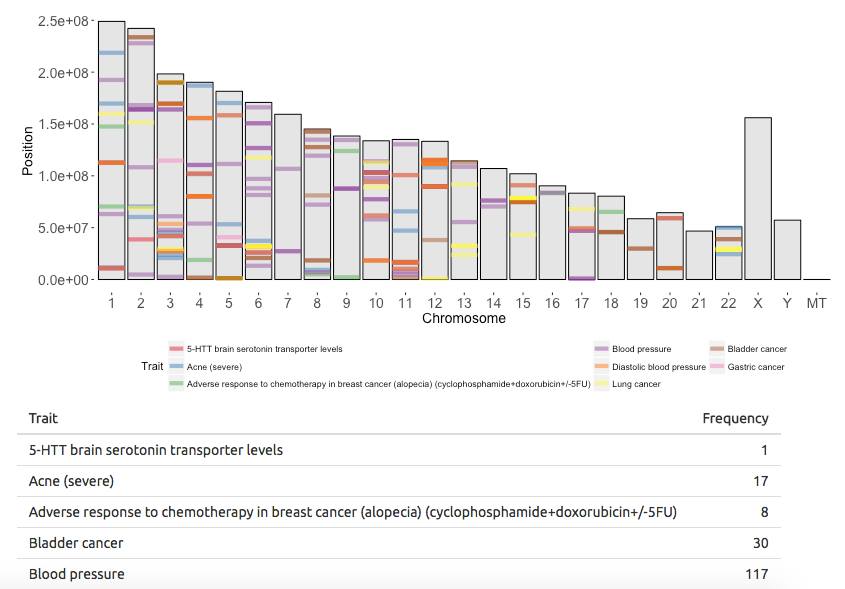
This app is based on the gwascat R package and its ebicat38 database and shows trait-associated SNP locations of the human genome. You can visualize and compare the genomic locations of up to 8 traits simultaneously.
Continue reading...
In my last post I created a gene homology network for human genes. In this post I want to extend the network to include edges for other species.
Continue reading...
Edited on 20 December 2016
Continue reading...
This post is in reply to a request: How did I set up this R blog?
Continue reading...
In last week’s post I explored whether machine learning models can be applied to predict flu deaths from the 2013 outbreak of influenza A H7N9 in China. There, I compared random forests, elastic-net regularized generalized linear models, k-nearest neighbors, penalized discriminant analysis, stabilized linear discriminant analysis, nearest shrunken centroids, single C5.0 tree and partial least squares.
Continue reading...
Edited on 26 December 2016
Continue reading...
Last week’s post showed how to create a Gilmore Girls character network.
Continue reading...
With the impending (and by many - including me - much awaited) Gilmore Girls Revival, I wanted to take a somewhat different look at our beloved characters from Stars Hollow.
Continue reading...
Text mining and sentiment analysis of a Stuff You Should Know Podcast
Continue reading...
How many transcripts and proteins do genes have?
Continue reading...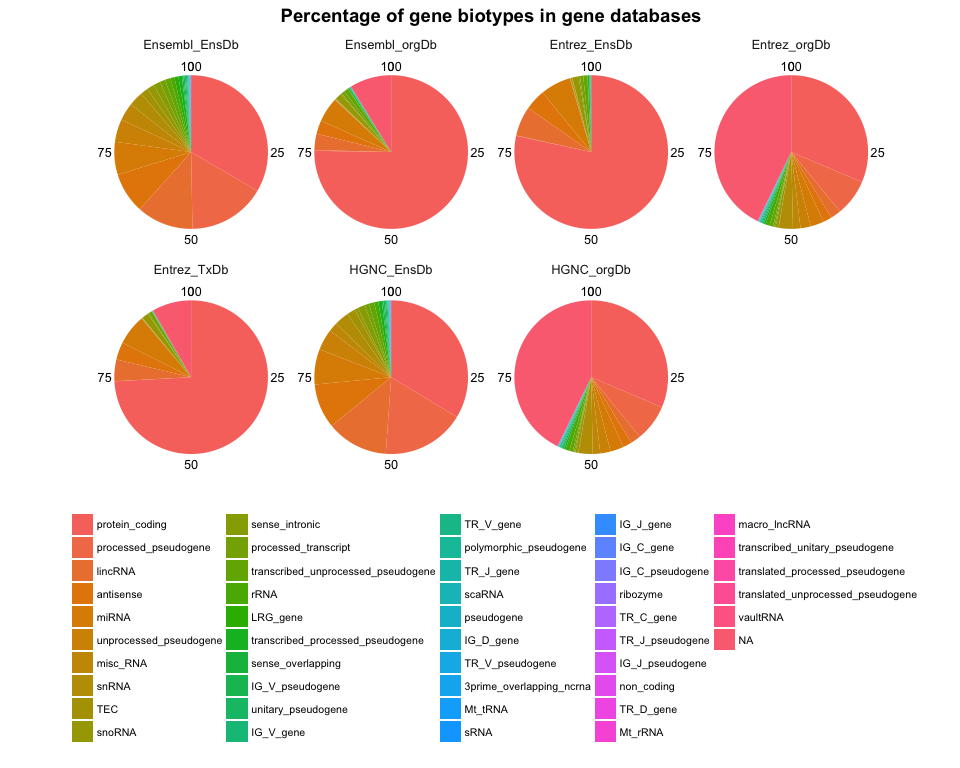
When working with any type of genome data, we often look for annotation information about genes, e.g. what’s the gene’s full name, what’s its abbreviated symbol, what ID it has in other databases, what functions have been described, how many and which transcripts exist, etc.
Continue reading...
Mapping GPS data from our USA/ Canada Roadtrip
Continue reading...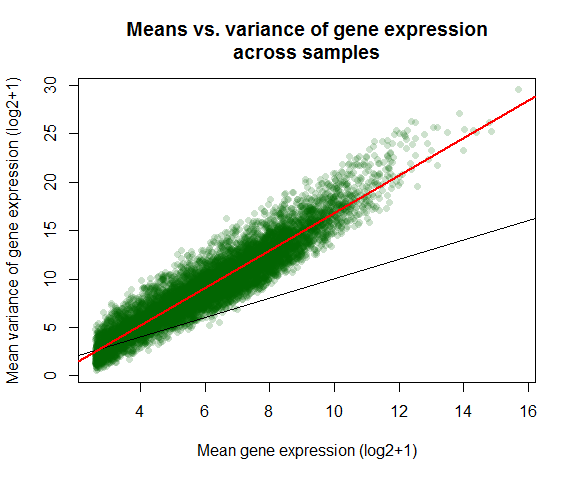
Continue reading...

I created the R package exprAnalysis designed to streamline my RNA-seq data analysis pipeline. Below you find the vignette for installation and usage of the package.
Continue reading...- Prev
- 1
- Next
Also check out R-bloggers for lots of cool R stuff!


